Social Commerce as a Catalyst for Agribusiness Development
Evaluating the Impact of TikTok Shop Training on Entrepreneurial Performance in Malaysia
Abd Razzif Abd Razak*, Siti Faizah Zainal, Siti Nurulaini Azmi, Nur Hafizah Roslan, Nur Syairah Ani Faculty of Management and Economics, Universiti Pendidikan Sultan Idris, Perak, Malaysia
Rebuilt from the approved Social Commerce manuscript text. Each model-specific DOCX is structured as a 17-page JABM Case Study manuscript with 7 tables, 5 figures, and full correlation analysis.
Abstract
The updated manuscript set uses the approved Social Commerce manuscript text as the content source while preserving the corrected JABM Case Study template. The study evaluates the Agromarketing Masterclass TikTok Shop Edition using official FAMA programme records from June to December 2024, covering 80 participating companies, 160 entrepreneurs and 425 stock-keeping units. The programme generated RM6,205,957.06 in cumulative sales and achieved a reported return on investment of 1:31.
Keywords: Agribusiness marketing; TikTok Shop; social commerce; digital entrepreneurship; agropreneurs; FAMA; Malaysia
Introduction
Social commerce has changed the way small agribusinesses acquire customers, demonstrate product value and convert attention into sales. Platforms such as TikTok Shop combine entertainment, community interaction, payment facilities and fulfilment functions in a single commercial environment.
In Malaysia, FAMA introduced the Agromarketing Masterclass TikTok Shop Edition as a structured training and performance-monitoring intervention to strengthen practical selling capability on TikTok Shop. This manuscript evaluates programme-generated sales, channel and seller performance evidence.
Literature Review
Social commerce differs from conventional e-commerce because purchase decisions are shaped by social interaction, creator credibility, entertainment value and real-time product demonstration. JABM studies on online agricultural purchasing, e-commerce readiness among FAMA traders and FAMA market-access programmes provide the agribusiness marketing foundation for this study.
The Resource-Based View explains performance differences through resources such as digital storytelling, product demonstration skill and storefront management. Dynamic Capabilities Theory explains how entrepreneurs adapt livestream timing, content themes and offers as platforms and consumers change.
Methodology
The study uses a quantitative descriptive and aggregate correlational design. The dataset is the official FAMA TikTok Shop performance record for the Agromarketing Masterclass TikTok Shop Edition, including the Projek Perintis Report for December 2024. The analysis covers June to December 2024.
Findings
Six source tables from the FAMA TikTok Shop Performance JABM and Projek Perintis JABM.
Table 1: Distribution of Participating Companies by State
| No. | State | Companies | Share (%) |
|---|---|---|---|
| 1 | Perlis | 1 | 1.3 |
| 2 | Kedah | 3 | 3.8 |
| 3 | Penang | 2 | 2.5 |
| 4 | Perak | 8 | 10.0 |
| 5 | Kuala Lumpur | 6 | 7.5 |
| 6 | Selangor | 33 | 41.3 |
| 7 | Negeri Sembilan | 5 | 6.3 |
| 8 | Melaka | 1 | 1.3 |
| 9 | Johor | 4 | 5.0 |
| 10 | Pahang | 3 | 3.8 |
| 11 | Kelantan | 8 | 10.0 |
| 12 | Terengganu | 4 | 5.0 |
| 13 | Sabah | 1 | 1.3 |
| 14 | Sarawak | 1 | 1.3 |
| Total | Total | 80 | 100.0 |
Source: FAMA TikTok Shop Performance JABM (2024).
Table 2: Summary of Agromarketing Masterclass TikTok Shop Edition Performance
| No. | Item | Value |
|---|---|---|
| 1 | Number of Companies | 80 |
| 2 | Number of Participants | 160 |
| 3 | Training Courses Conducted | 2 |
| 4 | Companies Fresh Product Category | 11 |
| 5 | Companies Processed Product Category | 69 |
| 6 | Total SKUs Marketed | 425 |
| 7 | PWD-owned Companies | 13 |
| 8 | June 2-hr Live Session Sales | RM12,657.15 |
| 9 | July 2-hr Live Session Sales | RM4,274.31 |
| 10 | Total Sales December 2024 | RM1,705,942.05 |
| 11 | Total Cumulative Sales | RM6,205,957.06 |
| 12 | Return on Investment (ROI) | 1:31 |
Source: FAMA TikTok Shop Performance JABM (2024).
Table 3: Sales Value by Sales Channel
| Sales Channel | Description | Sales (RM) | Share (%) |
|---|---|---|---|
| Livestream | Sales through live-stream sessions | 2,105,670.00 | 33.9 |
| Window (Profile) | Purchases through TikTok Shop profile window | 1,875,034.00 | 30.1 |
| Short Video | Sales from short-video content | 1,621,255.00 | 26.1 |
| Others (Shop Tab) | Sales through Shop Tab browsing | 603,998.06 | 9.9 |
| Total | 6,205,957.06 | 100.0 |
Source: FAMA TikTok Shop Performance JABM (2024).
Table 4: Monthly Programme Performance, June to December 2024
| Month | Total Sales (RM) | Livestream (RM) | Short Video (RM) | Products Sold | Orders |
|---|---|---|---|---|---|
| June | 497,762.95 | 194,759.55 | 180,940.23 | 21,280 | 3,271 |
| July | 507,967.92 | 174,190.65 | 193,101.29 | 22,298 | 3,381 |
| August | 728,225.46 | 259,453.12 | 300,783.08 | 34,583 | 4,645 |
| September | 692,259.02 | 263,009.12 | 263,940.70 | 25,617 | 7,159 |
| October | 814,482.14 | 323,530.03 | 317,551.16 | 32,334 | 6,164 |
| November | 1,259,317.52 | 402,162.25 | 638,313.61 | 37,804 | 10,194 |
| December | 1,705,942.05 | 582,847.27 | 871,599.37 | 45,192 | 14,571 |
Source: Projek Perintis JABM (December 2024), Summary sheet.
Table 5: Top Ten Sellers by GMV in December 2024
| Rank | Shop Name | Batch | SOF | OKU | GMV (RM) |
|---|---|---|---|---|---|
| 1 | Chef Ustazah HQ | Batch 2 | N | No | 689,517.94 |
| 2 | kerepek azharfood | Batch 1 | N | No | 533,945.85 |
| 3 | Munif Cocoa @ Koko Spread Sedap | Batch 1 | N | No | 173,804.07 |
| 4 | DASTO HQ | Batch 2 | N | No | 107,254.26 |
| 5 | Dapur Pak Amir | Batch 1 | N | Yes | 39,562.30 |
| 6 | Baja Taiping | Batch 2 | N | No | 37,368.97 |
| 7 | Ayamhalalbismi | Batch 1 | Y | No | 20,120.58 |
| 8 | RIZQ MART | Batch 1 | Y | Yes | 15,701.73 |
| 9 | Corndog Anak Ramai HQ | Batch 2 | Y | No | 10,396.60 |
| 10 | PEMPUR | Batch 2 | N | No | 9,770.79 |
Source: Projek Perintis JABM (December 2024), Seller GMV sheet. SOF = Sales from Farm. OKU = Orang Kurang Upaya.
Seller-level GMV shows benefits were concentrated. In December 2024, 55 sellers recorded positive GMV while 25 sellers recorded zero GMV. The top ten sellers accounted for a large share of total programme sales. The policy response should be segmentation: high performers need scaling support and inventory readiness; moderate performers need conversion coaching; inactive sellers need diagnostic assessment before further training.
Table 6: Pearson Correlation Analysis Indicators Correlated with Total Monthly Sales
| Indicator | Pearson r | p-value | Sig. |
|---|---|---|---|
| Livestream sales (RM) | 0.989 | <.0001 | ** |
| Short-video sales (RM) | 0.997 | <.0001 | ** |
| Profile/window sales (RM) | 0.971 | 0.0003 | ** |
| Other/shop-tab sales (RM) | 0.972 | 0.0002 | ** |
| Orders | 0.977 | 0.0002 | ** |
| Products sold | 0.930 | 0.0024 | ** |
| Products for sale | -0.011 | 0.9807 | ns |
| Live-stream content volume | 0.720 | 0.0683 | ns |
| Short-video content volume | 0.414 | 0.3556 | ns |
| Total content volume | 0.538 | 0.2133 | ns |
Note: ** p < .01; ns = not significant; source: author calculation based on Projek Perintis JABM (December 2024), n = 7 months.
Figures
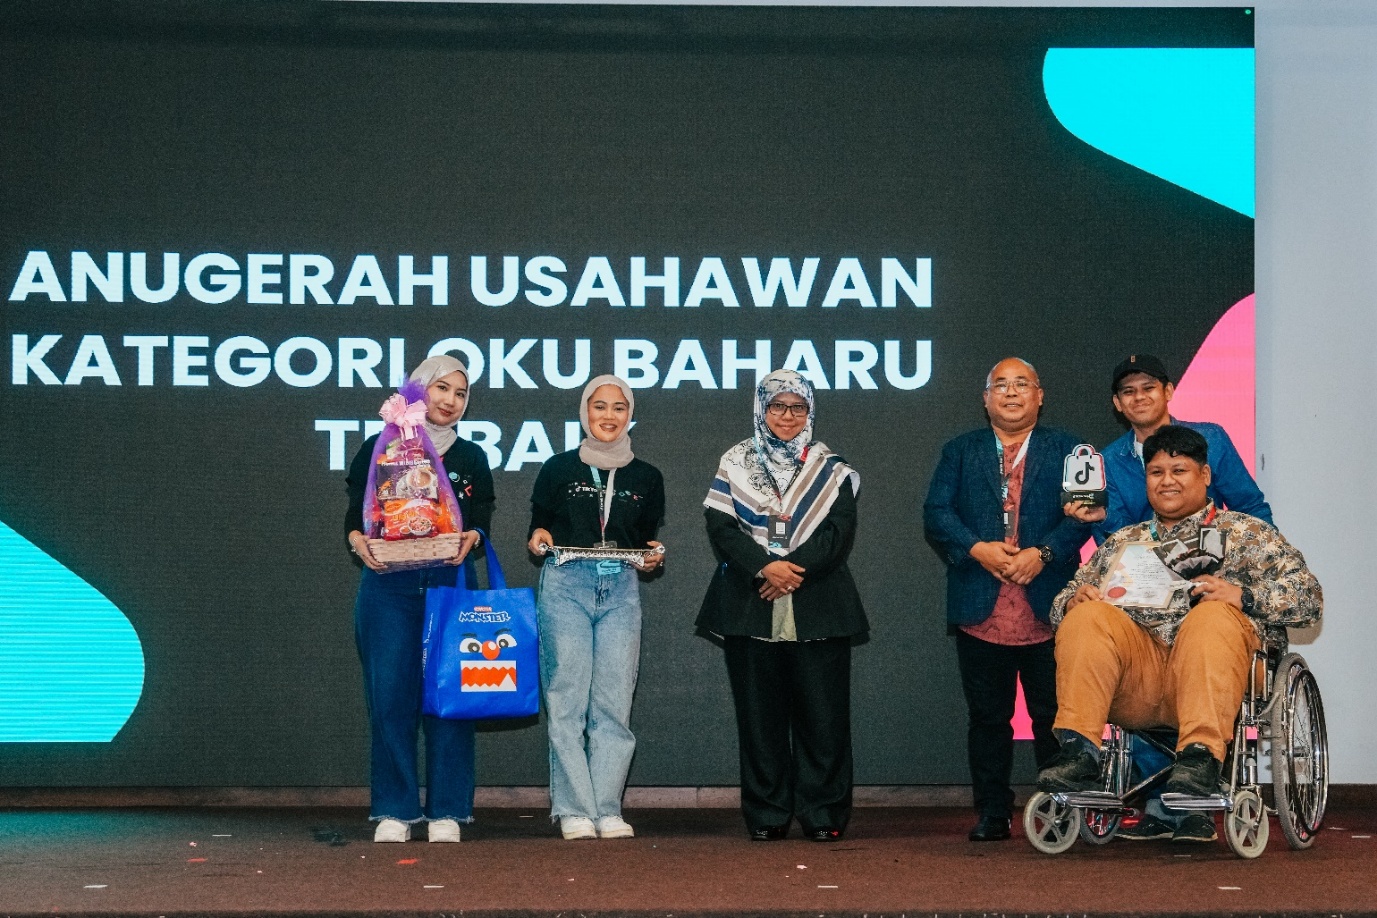
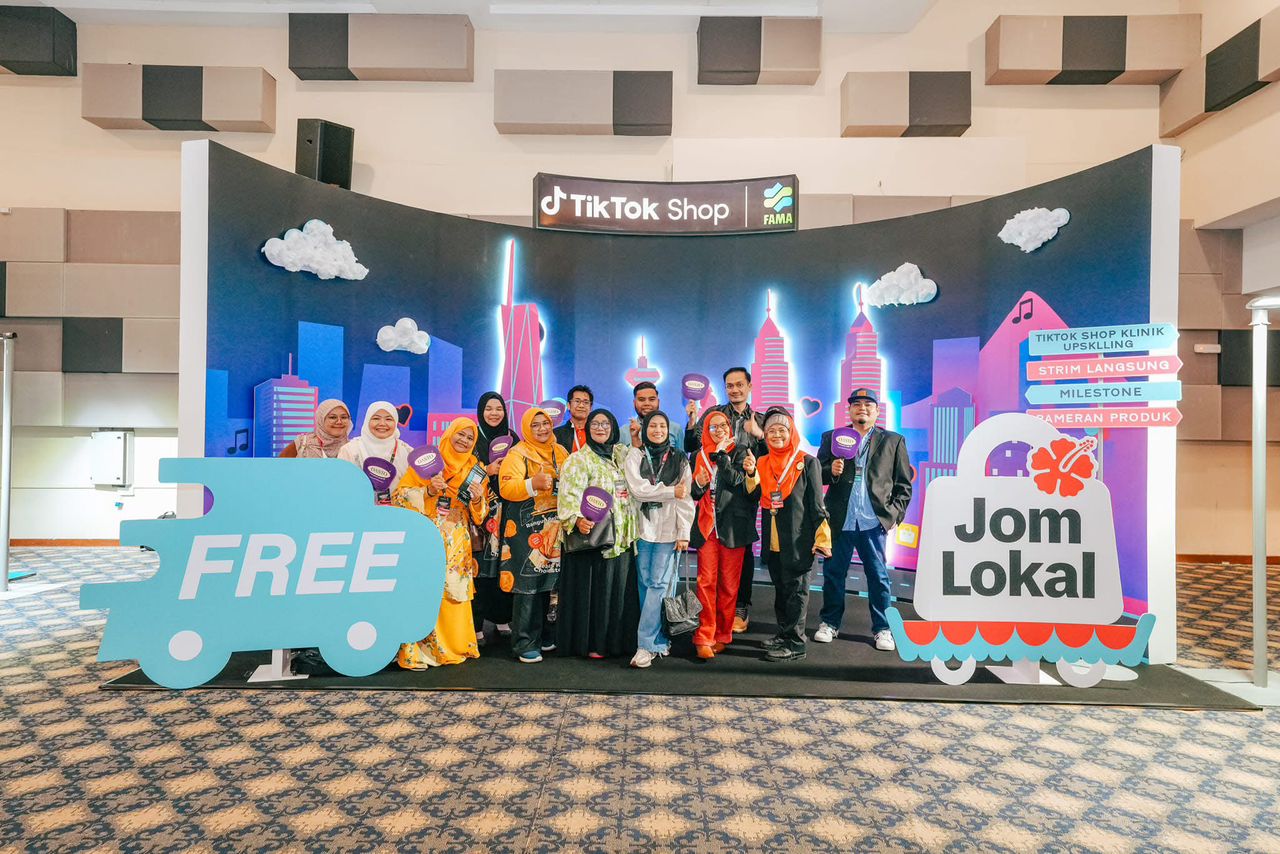
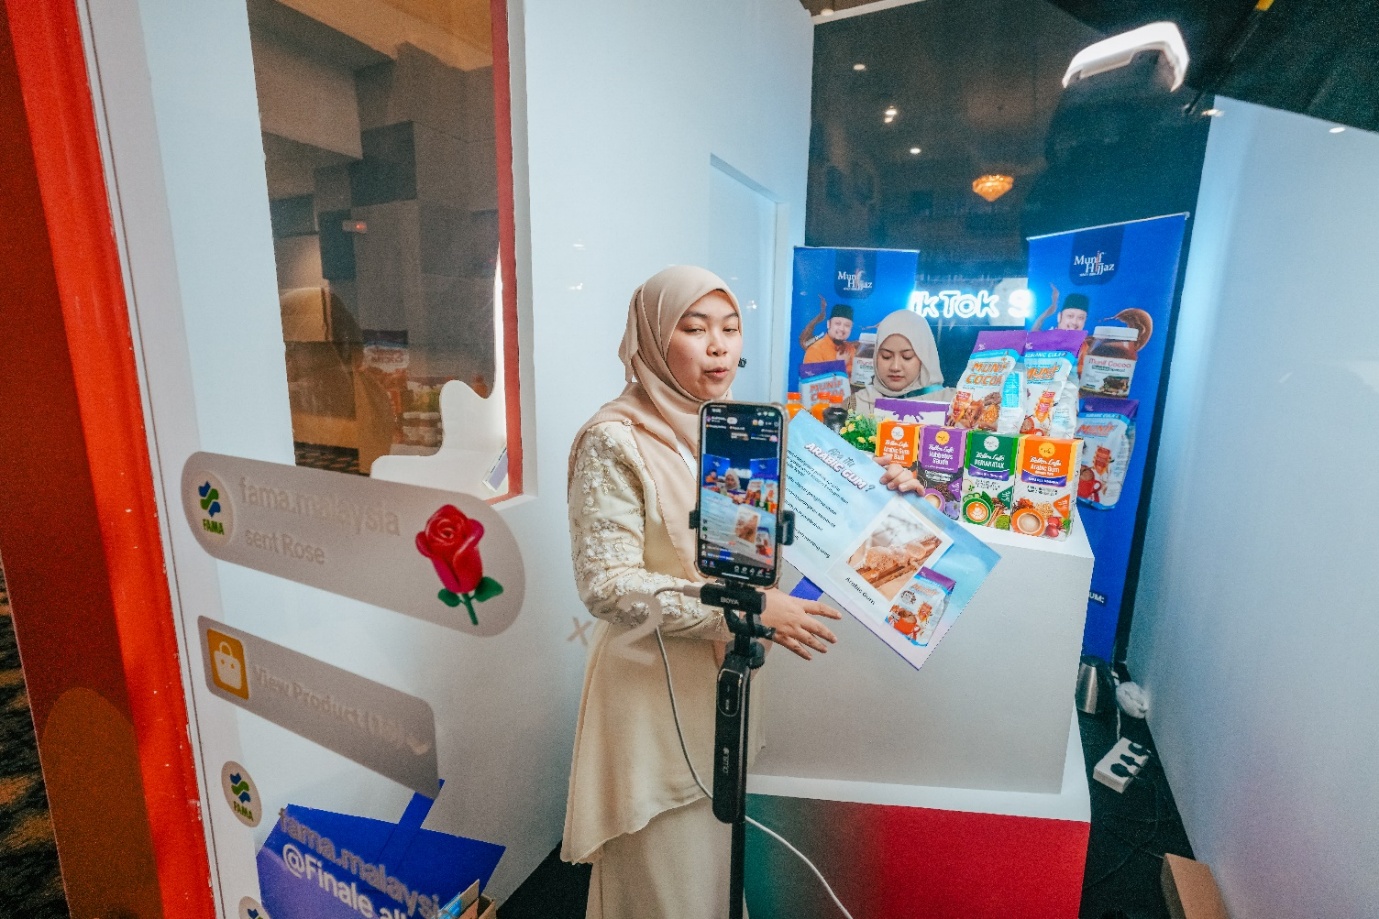
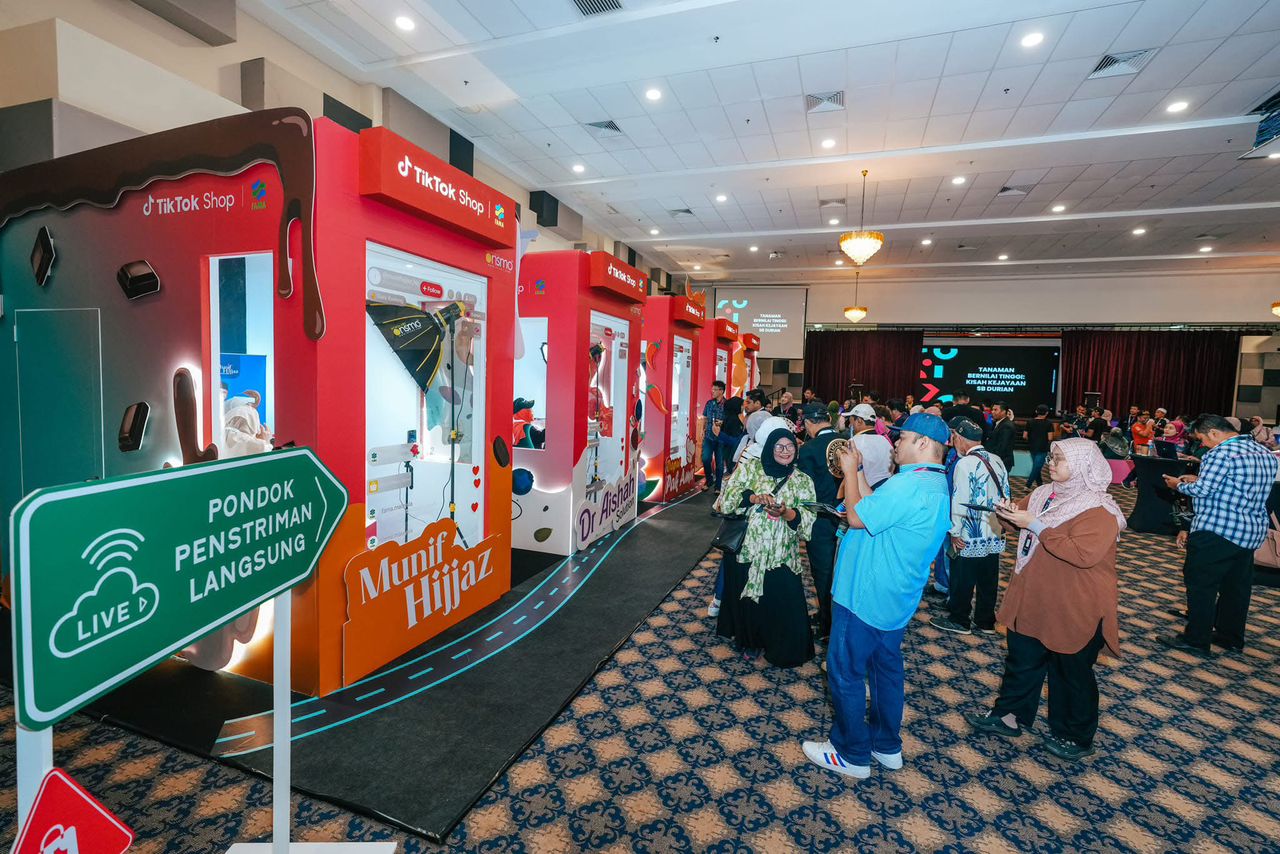
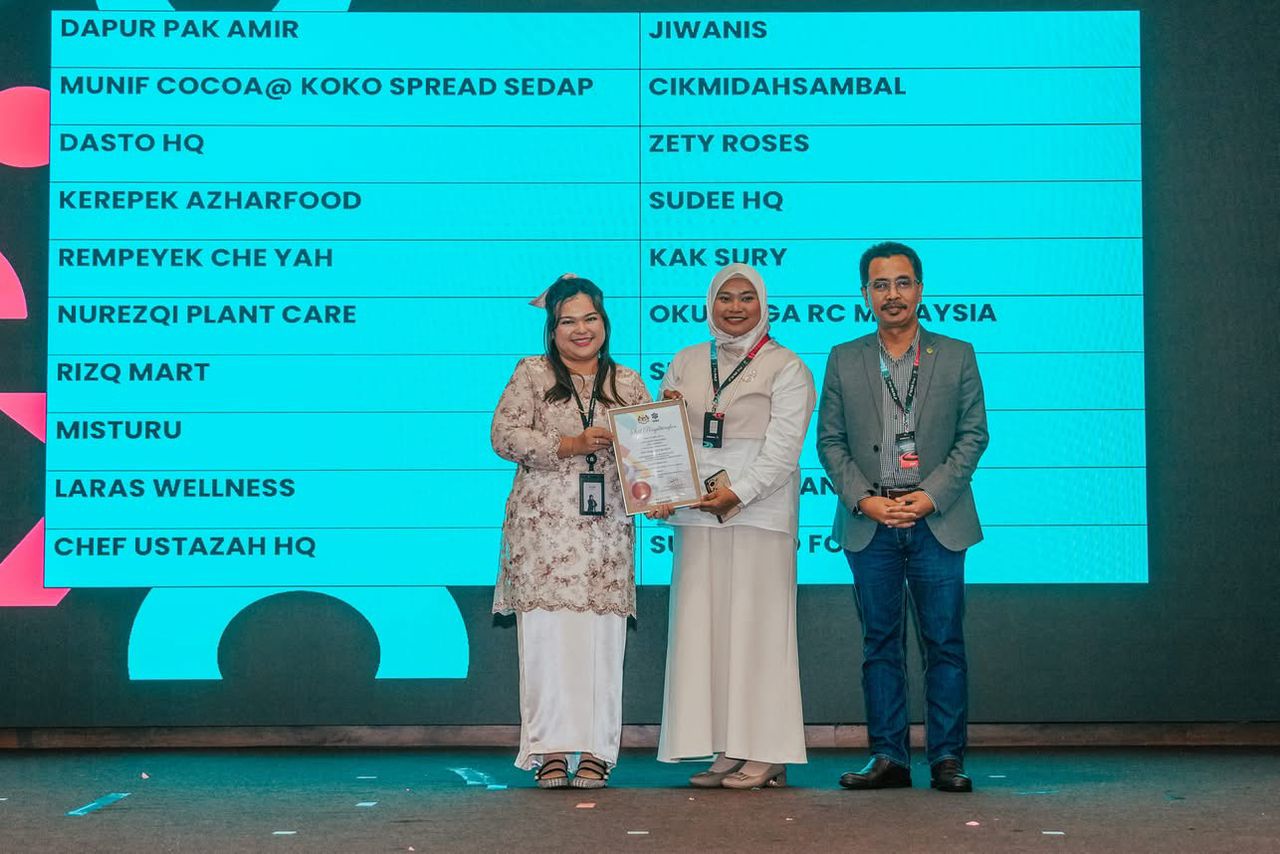
Five official images from the Agromarketing Masterclass TikTok Shop Edition programme. Click any image to zoom and pan.
Discussion
The findings demonstrate that social commerce can operate as an agribusiness growth mechanism when training, platform access and performance monitoring are integrated. The RM6.2 million cumulative sales outcome and 1:31 ROI indicate measurable commercial returns.
From an RBV perspective, value was created through content capability, live selling skill and storefront execution. From a Dynamic Capabilities perspective, the monitoring period allowed entrepreneurs to learn and adapt.
The correlation results support a commercial reading of the programme. Short-video sales, livestream sales, orders, shop-tab sales, profile-window sales and products sold all correlated strongly with total monthly sales. The weaker result is just as important: content volume was not consistently significant. This is a useful correction to common digital-training advice that emphasises content quantity over content quality and conversion strategy.
The strongest caution is distribution. A strong total GMV can hide inactive sellers. Public agencies should avoid reporting only headline sales without activation rates, seller segmentation and seller-level variance.
Practical and Policy Implications
FAMA should continue the programme but redesign the post-training layer. The next cohort should include conversion clinics, livestream scripts, product-bundle coaching, shop-profile audits, customer-response templates, fulfilment discipline and post-campaign review. High performers need scaling support, campaign planning and inventory readiness. Moderate performers need conversion coaching on livestream technique, offer design and storefront execution. Inactive sellers need diagnostic assessment identifying whether the barrier is skill, motivation, product readiness or platform access.
Policymakers should use standardised metrics for future programmes: channel sales, orders, average order value, content performance, seller-level ROI and activation rate. Content quality and conversion strategy matter more than content volume alone. The programme also demonstrates that public-sector digitalisation can create direct economic returns when design includes platform partnership and performance monitoring this model could be adapted for other agricultural agencies and commodities across Malaysia.
Conclusion
The Agromarketing Masterclass TikTok Shop Edition offers a credible model for integrating digital entrepreneurship training, platform collaboration and agribusiness marketing policy. The study shows that the programme produced measurable agribusiness outcomes: RM6,205,957.06 in cumulative sales, substantial channel diversification and strong aggregate-level correlations between sales activities and total performance.
The practical conclusion is: keep the programme, but make it sharper. Scale what works, segment sellers by performance, coach conversion rather than content volume, and build the analytics infrastructure to track seller-level causality in future cohorts. Future evaluations should collect seller-level analytics including live-session conversion rates, customer repeat rates and profit margins to support stronger causal analysis.
References
Abdul Rahman, S. F., Tan, P.-L., & Md Isa, A. (2024). Technology adoption readiness among fresh agricultural traders in using e-commerce platform in Malaysia. Journal of Agribusiness Marketing, 13(2).
Barney, J. (1991). Firm resources and sustained competitive advantage. Journal of Management, 17(1), 99-120.
FAMA. (2024). Projek Perintis JABM (December 2024): Agromarketing Masterclass TikTok Shop Edition performance dataset.
Hajli, N. (2015). Social commerce constructs and consumer's intention to buy. International Journal of Information Management, 35(2), 183-191.
Safari, S., & Nik Mohd Masdek, N. R. (2015). Consumers' perception and acceptance of fresh agriculture product purchased through e-business. Journal of Agribusiness Marketing, 7(1).
Shamsudin, M. F., Musa, W. A., Jalaludin, M. N. H., & Jamaludin, A. (2025). Assessing the impact of FAMA's direct sales programmes on small agricultural producers in Malaysia. Journal of Agribusiness Marketing, 14(1).
Teece, D. J. (2018). Business models and dynamic capabilities. Long Range Planning, 51(1), 40-49.
Detached System Self-Service JABM
Upload one or more DOCX manuscripts and enter a title. Choose an agent style Standard or Big Pickle then Ollama qwen3.5:cloud will redraft the content into a structured 17-page JABM Case Study report.
This section is password-protected. Enter the access code to continue.